In Fidelix CPU firmware there is an example Energy.dat file located in the “Bin” folder.
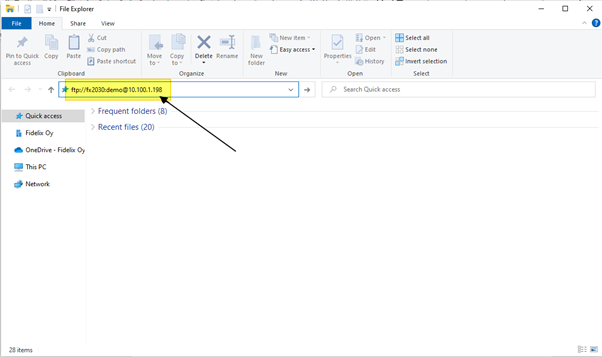
To find this example file open an FTP connection to the CPU. You can open an FTP connection by writing to your computers “File Explorer” the following:
ftp://fx2030:demo@10.100I.1.198
where “demo” is the FTP password of the CPU and “10.100.1.198” is the IP-address of the CPU.
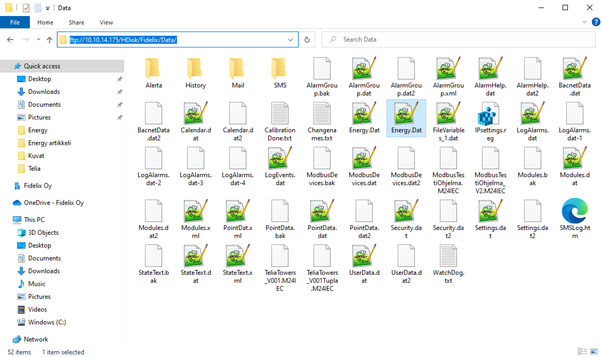
Then go to the folder “HDisk/Fidelix/Bin” and locate the file “Energy.Dat.sample”
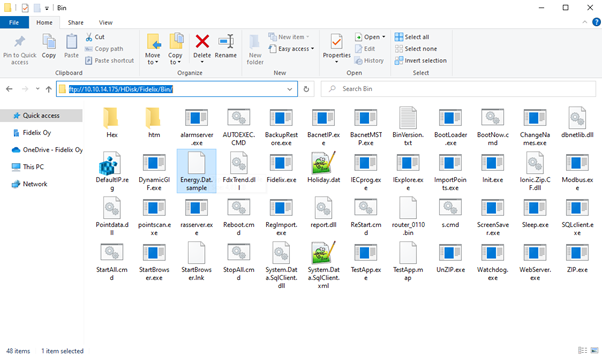
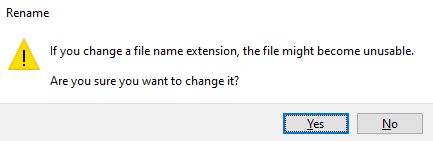
Copy this file to your computer and rename the file as “Energy.Dat”
This will change the file to a “.Dat” file, click yes if your computer asks if you want to change the file.
Now open the “Energy.Dat” file with a text editing program, for example Notepad++.
In the file is an example of an energy report that will show the daily, weekly and monthly consumptions for a heating energy meter, electric energy meter and water meter. You can use this file as is by just adding in the correct point ID:s.
The following steps will show how this file is made so you can understand how to add more to the report.
Creating a new Energy.dat file.
When creating a consumption report we start by adding the following line to the file.
Version=859
The first row in the Energy.dat file must always be “Version=859”, otherwise the file will not work.
Next we will create a report for absolute energy consumption. In the first row, basic settings for the report are given.
[1/Heat/Consumption(Month)]
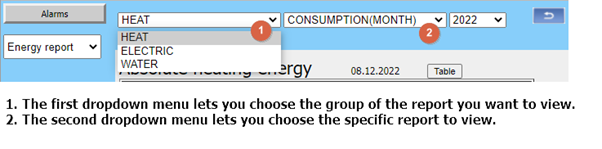
The first variable “1” is used to determine the reporting accuracy. With value 1, report will show monthly consumptions for a year. With value 2, daily consumptions of a chosen month are shown, with value 3, weekly values of a year are shown.
The second variable “Heat” is the name of the group for the report. With these group names you can make it easier to view the desired reports in the substation user interface. For example all heating energy reports could be under group “Heat”, all electric energy reports could be under group “Electric” and all water consumption reports under “Water”.
The third variable “Consumption(Month)” is the name of the report that is used to find the correct report to view in the user interface.
Below is an example of what this looks like in the substation user interface.
The next row in the Energy.dat file is used to give a header for the report, that will be displayed in the user interface, when viewing the report. For example for the absolute heating energy report, the header could be the following.
Header=Absolute heating energy
With the next rows we create the columns of data to be viewed in the report. For this we use rows with the following structure.
Col= field1, field2, field3, field4, field5, field6, field7
The values to be put in the different fields are explained below.
Field 1
Field 1 can have values 1, 2.x, 100 or 101.x.
Field 1, value 1 = Compare column. When comparing values between different data columns, field 1 will have the value 1.
Field 1, value 2.x = Normalized heating energy. When you want to display the normalized heating energy, field 1 will have the value 2.x, where the x chooses the year for display, 2.0=current year, 2.1=previous year, etc.
Field 1, value 100 = Day degree values of normal year. With field1 having the value 100, the normal year day degree values will be displayed in the column.
Field 1, value 101.x = Measured consumption. To display the measured consumption, field 1 will have the value 101.x, where the x chooses the year for display, 101.0=current year, 101.1=previous year, etc.
Field 2
Field 2 value depends on the value of field 1.
Field 1, value 1 = field 2 will have the format index1&index2, where the index1 and index2 are the numbers of the data columns to be compared. For example, field2 could be: 1&2
Field 1, value 2.x = field 2 will have the format index1&index2&index3, where index1 is the number of the column containing the day degree values of a normal year, index 2 is the number of the column containing the measured day degree values and index3 is the number of the column containing the measured energy values. For example, field 2 could be 1&2&3
Field 1, value 100 = field 2 will be left empty.
Field 1, value 101.x = field 2 will contain the point ID of the analogue point in the CPU that measures the consumption of the meter. For example, field 2 could be TEST_QQ01_KWH_M
Field 3
Field 3 contains the unit of the data displayed in the column. For example, field 3 could be MWh or C or %
Field 4
Field 4 is used to choose whether the data column is displayed in the table view of the user interface. With value 0, data will not be displayed, with value 1, data will be displayed.
Field 5
Field 5 is used to choose whether the data column is displayed in the graph view of the user interface. With value 0, data will not be displayed, with value 1, data will be displayed.
Field 6
Field 6 is used to choose the number of decimals used in the table view for the data.
Field 7
Field 7 contains a header for the data column.
Example of the column rows for a heating energy consumption below.
Col=101:0     ,TEST_HEATING_FM     ,MWh     ,1     ,1     ,2     ,Consumption
Col=1         ,1&3                 ,%       ,1     ,0     ,1     ,Comparison
Col=101:1     ,TEST_HEATING_FM     ,MWh     ,1     ,1     ,2     ,Consumption
Col=1         ,3&5                 ,%       ,1     ,0     ,1     ,Comparison
Col=101:2     ,TEST_HEATING_FM     ,MWh     ,1     ,1     ,2     ,Consumption
The first data column is used to display the measured energy consumption of the current year.
The second data column is used to display the difference of the measured consumption for the current year and the previous year.
The third data column shows the measured energy consumption of the previous year.
The fourth data column shows the difference of the measured consumption for the previous year and the year before that.
The fifth data column shows the measured energy consumption of the year before the previous year.
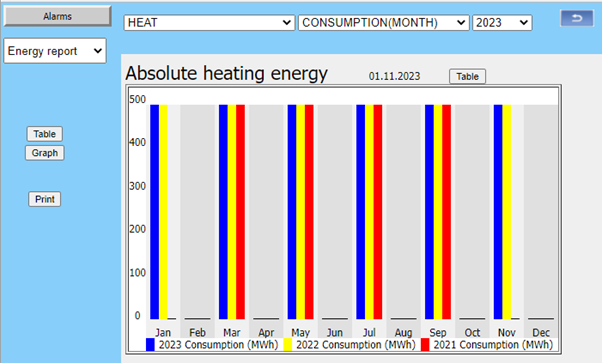
And below is an example of how this can look like in the user interface.
Graph view:
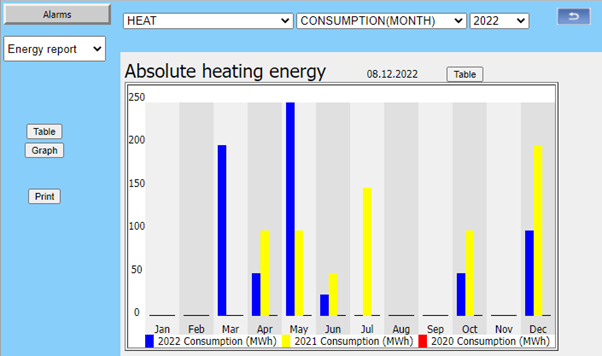
Table view:

Normalized heating energy report.
To create a normalized heating energy report a few rows will need to be added to the start of the Energy.dat file to define parameters for heating energy normalizing.
The rows to be added are explained below.
[Normalize]
DayDegree=647,612,566,383,153,11,1,12,125,316,464,588
DomesticWaterRatio=0.0
Formula=1
The first row is to start the normalization parameter section in the file.
In the second row the day degree values of a normal year are given. With each month’s values separated by “,”. In this example the normal values of Helsinki are used.
In the third row is a multiplier, for compensating away the portion of heating energy used by domestic water. If this consumption doesn’t need to be compensated away, the multiplier can be left as 0.0. Else if for example domestic water uses approximately 20% of the heating energy, the multiplier would be 0.2.
The fourth row selects the formula to be used in the normalization calculation. Two different formulas are available and are chosen with giving this variable the values 1 or 2.
The formulas are explained below.
Qt = Measured energy
Qn = Normalized energy
Qd = Domestic water energy (Domestic water ratio * Qt)
Sn = Normal day degree value
St = Measured day degree value
Formula 1: Qn = Qd + (Qt – Qd) / Sn / St
Formula 2: Qn = Qt / (Qd / Qt + St / Sn * (1 – Qd / Qt))
Then to add a normalized energy report to the substation the contents of the report data columns are defined similarly as before.
Example of the column rows for a heating energy consumption below.
[1/Heat/Normalized(Month)]
Header=Normalized consumption
Col=100       ,                      ,C       ,1     ,0     ,0     ,Day Degree<br>Normal year
Col=101:0     ,TEST_DAYDEGREE_FM     ,C       ,1     ,0     ,0     ,Day Degree
Col=101:1     ,TEST_DAYDEGREE_FM     ,C       ,1     ,0     ,0     ,Day Degree
Col=101:2     ,TEST_DAYDEGREE_FM     ,C       ,1     ,0     ,0     ,Day Degree

Col=101:0     ,TEST_HEATING_FM       ,MWh     ,1     ,0     ,2     ,Consumption
Col=2:0       ,1&2&5                 ,MWh     ,1     ,1     ,2     ,Normalized
Col=1         ,6&9                   ,%       ,1     ,0     ,1     ,Comparison
Col=101:1     ,TEST_HEATING_FM       ,MWh     ,0     ,0     ,2     ,Consumption
Col=2:1       ,1&3&8                 ,MWh     ,1     ,1     ,2     ,Normalized
Col=1         ,9&12                  ,%       ,1     ,0     ,1     ,Comparison
Col=101:2     ,TEST_HEATING_FM       ,MWh     ,0     ,0     ,2     ,Consumption
Col=2:2       ,1&4&11                ,MWh     ,1     ,1     ,2     ,Normalized
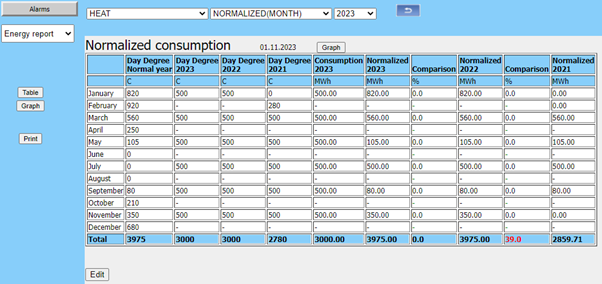
The first data column contains the day degree values for a normal year that were given at the normalization parameter section of the Energy.dat file.
The second, third and fourth columns contain the measured day degree values of the current year, the previous year and the year before that.
The fifth data column contains the measured energy consumption of the current year.
The sixth data column contains the normalized energy consumption of the current year.
The seventh data column contains a comparison between the normalized energy consumptions of the current year and the previous year.
The eight data column contains the measured energy consumption of the previous year.
The ninth data column contains the normalized energy consumption of the previous year.
The tenth data column contains a comparison between the normalized energy consumptions of the previous year and the year before that.
The eleventh data column contains the measured energy consumption of the year before the previous.
The twelfth data column contains the normalized energy consumption of the year before the previous.
And below is an example of how this can look like in the user interface
Graph view of the absolute energy consumption:
Graph view of the normalized energy consumption:
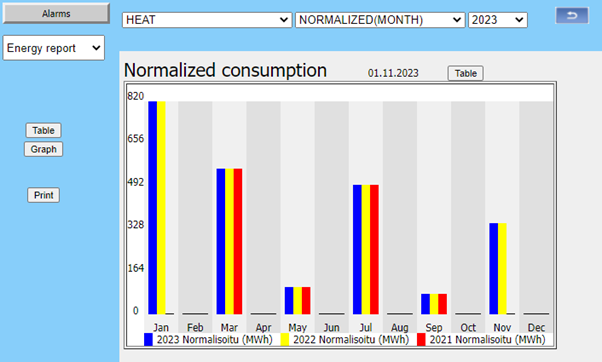
Table view of the absolute energy consumption:
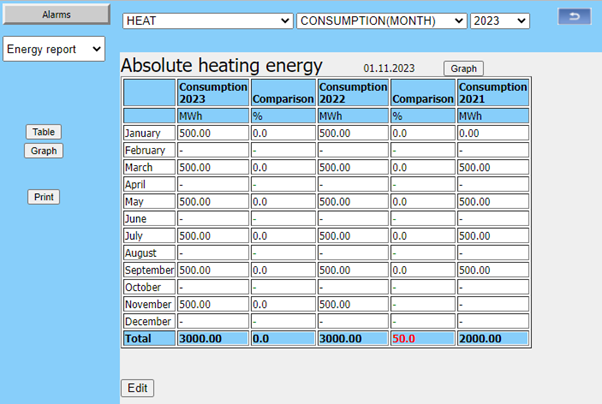
Table view of the normalized energy consumption:
When the Energy.dat file is ready, it must be loaded to the CPU again through FTP connection. The Energy.dat file must be loaded to the folder “HDisk/Fidelix/Data”.
When the file is loaded in, the CPU must be restarted for the new reports to show in the “Energy report” view.
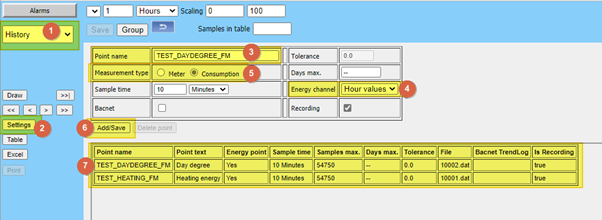
![]() Point settings for the measurements added to energy reports.
Point settings for the measurements added to energy reports.
Before the energy report can collect data from the measurement points the points need to be added to history recording.
- This is done in the CPU user interface when you select the option “History” from the first drop down menu on the left side of the screen.
- Then press the “Settings” button to open the point settings window.
- Copy the name of the point you want to create a report for to the field “Point name”.
- Choose the option “Hour values” or "Day values" from the “Energy channel” drop down menu.
- Make sure that the “Consumption” option is selected.
- Press the “Add/Save” button.
- All points that are included in the reports must be added similarly and shown on the list of history points. If a normalized energy is being calculated, also the measured day degree value must be added to the history recording in the same way.