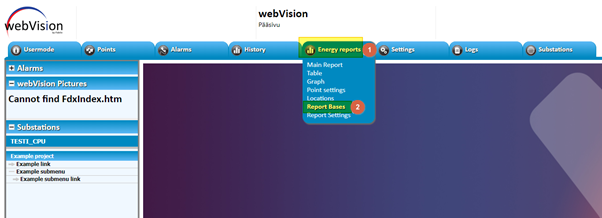
First go to “Energy reports” menu and choose option “Report Bases”.
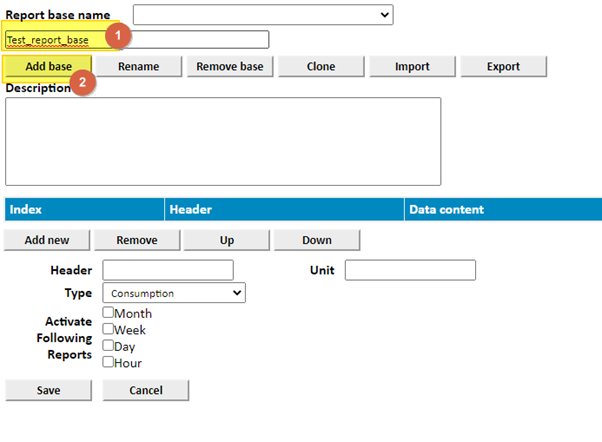
Then write a name for your report base, then click the “Add base” button.
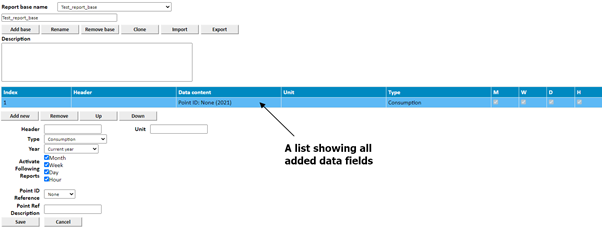
Now to add data fields to your report you will use the lower options.
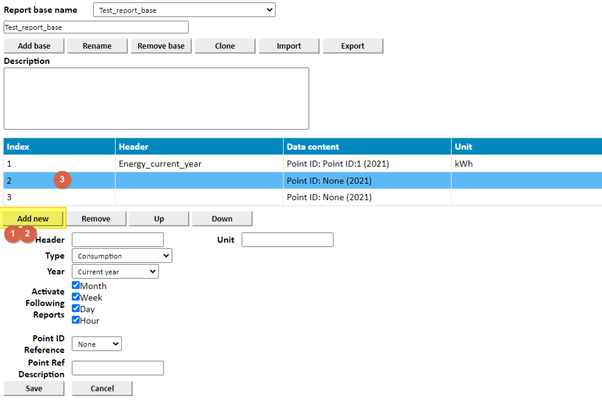
First click the “Add new” button to add a data field.
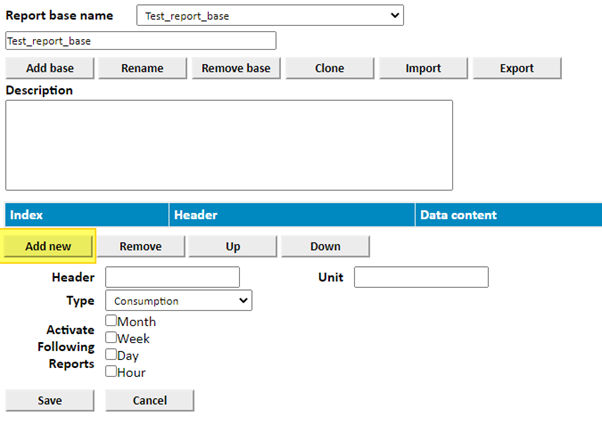
You will now see a new data field has been added to the report.
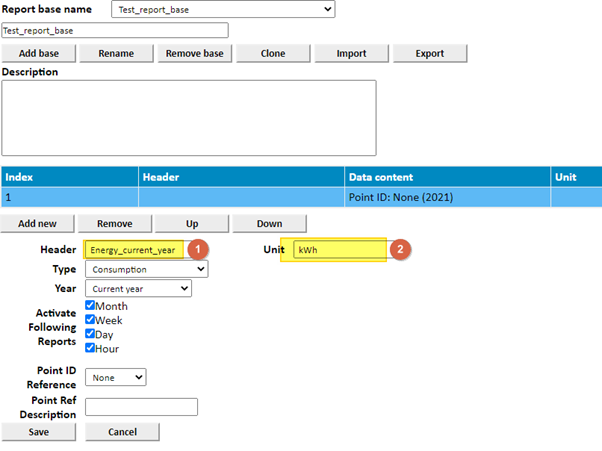
Give the data a name in the “Header” field and choose the unit for the data in the “Unit” field.
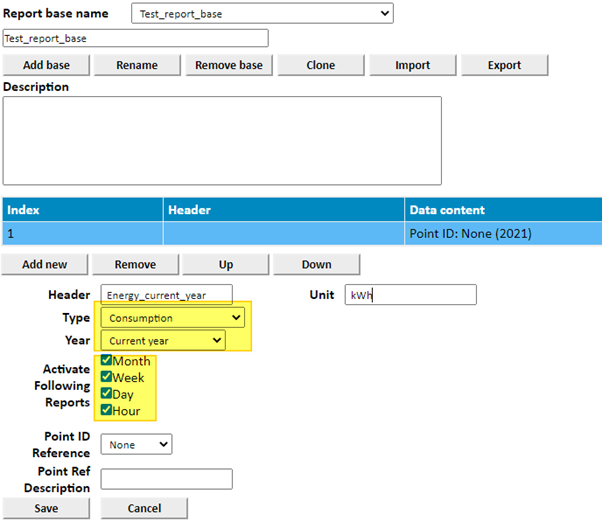
Then you can choose options for the report. For a consumption report the “Type” is “Consumption” and for the firs data field we will use the current year’s values. You can also choose the reports that you want for this data by ticking “Month”, “Week”, “Day” and “Hour” options on or off.
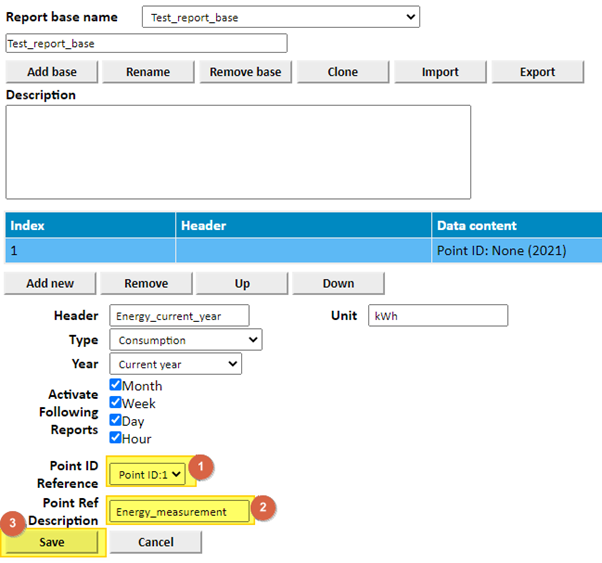
To link a point to the data field choose the “Point ID Reference” as “Point ID:1”. You can also write a description for the point that should be linked to this field. Then press the “Save” button.
Now you can use this report base as it is to create reports that show the energy consumption for the current year.
To see how to use the report bases to create reports see article:
https://info.fidelix.fi/en/knowledge/how-to-make-a-consumption-report-in-fidelix-webvision
But let’s add two more data fields to give the report more value. One to display last years consumption values and one to compare the two years.
Click twice on the “Add new” button. Then click on the second row in the list of data fields.
Then choose the options for the field. This will use the same options as the first row, but in the “Year” field we will choose “Current year minus 1”. As this field is for data from the same measurement, only from a different year, as the first row was, the same point ID is linked to this row as well “Point ID:1”.
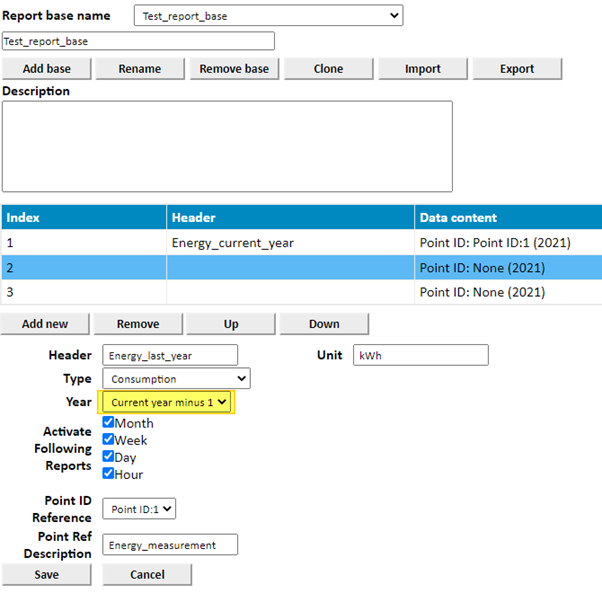
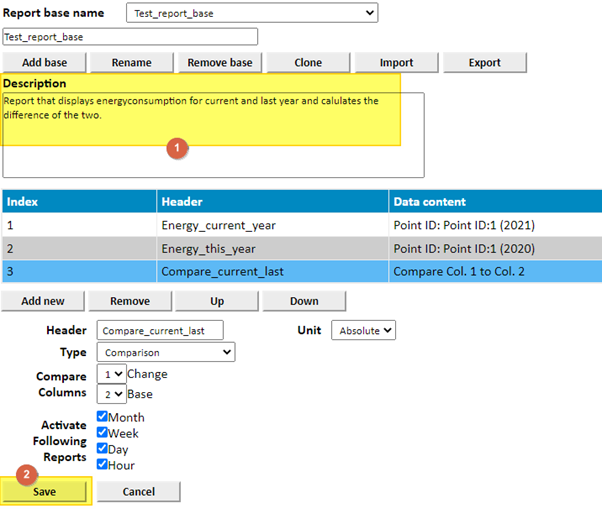
Click the “Save” button to save the changes to the second row, then click on the third row to set the options to it.
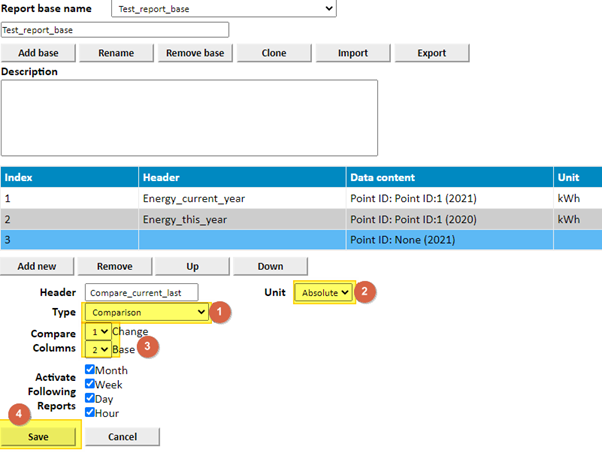
This data field will be for comparing the two year’s values, so we will choose the type as “Comparison”. Now in the “Unit” field, instead of writing a unit, you can choose whether the comparison is done as “Relative” or “Absolute” comparison.
The relative comparison will calculate the % difference of the two measurements.
The Absolute comparison will calculate the difference of the values.
Then choose the data fields that you are comparing with the “Compare Columns” options.
And lastly click the “Save" button.
You can also write a description for the report base in the “Description” field so others can better understand the functionality of your report base. Type in the description and click the “Save” button.