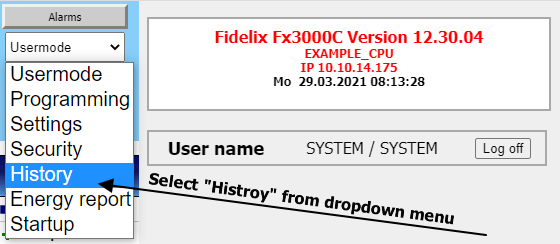
From the dropdown menu at the top left of the substation user interface select the option "History"
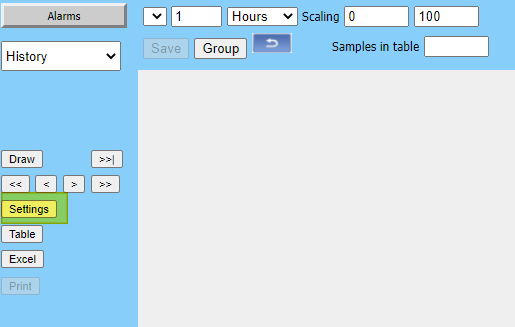
Click on "Settings" button.
Here you can activate history recording to points in the CPU.
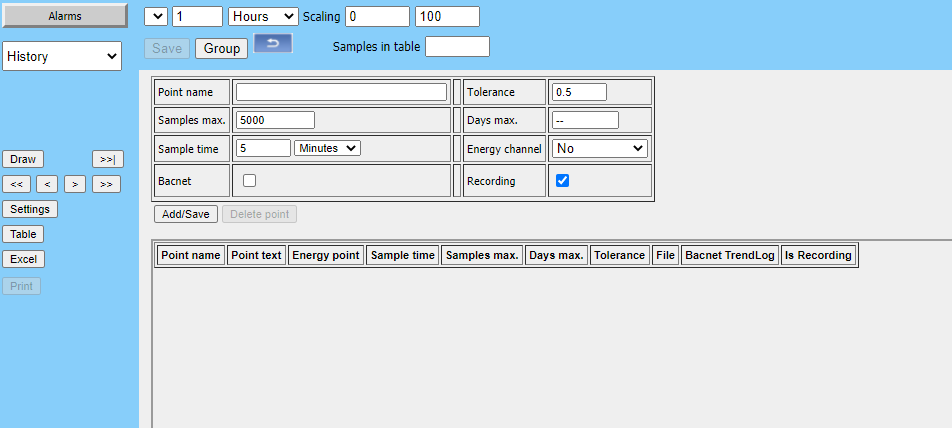
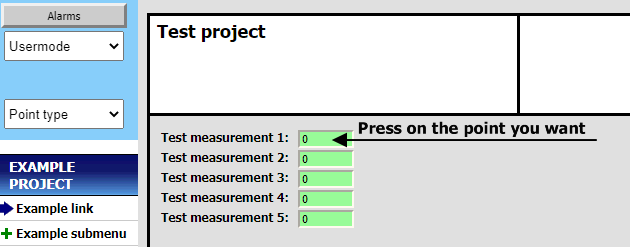
In the "Point name" field write in the ID of the point you want to set to history recording.
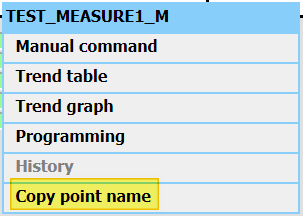
Point ID can be copied from graphic by pressing on the point.
Then choose from the menu that opens the option "Copy point name"
When you have the point name set, you can select the options for how the points data will be recorded.
In the field "Samples max." you can choose how many samples from the point will be saved. Once the maximum amount of samples is reached the oldest values will be erased when saving new values. Maximum amount of samples for each point can be 20 000.
In the field "Sample time" you can choose the interval of saving the points value as a sample. Write in the field the number and choose from the dropdown menu whether the value is in seconds, minutes, hours or days.
Now you can press the "Add/Save" button and the point will show on the list of saved points below.
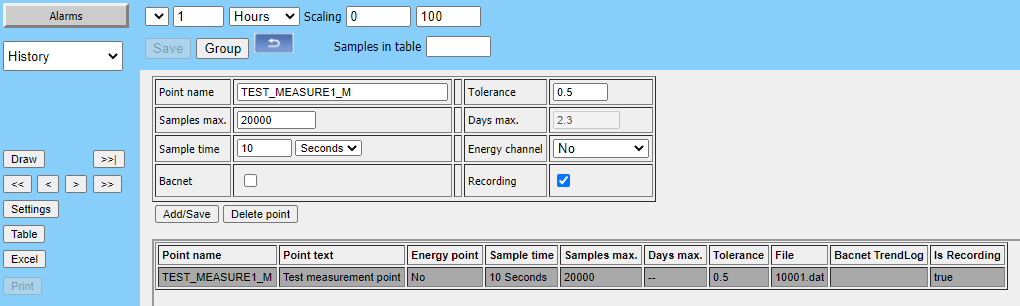
The value in "Days max." field is calculated and is dependent on the Samples max. and Sample time values. This will tell you how long back the history of the point can be viewed with current settings.
With the value in "Tolerance" field, you can set a minimum value change for saving a sample. This can extend the length of the history as not all samples are saved, if the value has not changed enough.
In order to view the history data you need to create a history group for the points.
To do this press on the "Group" button.
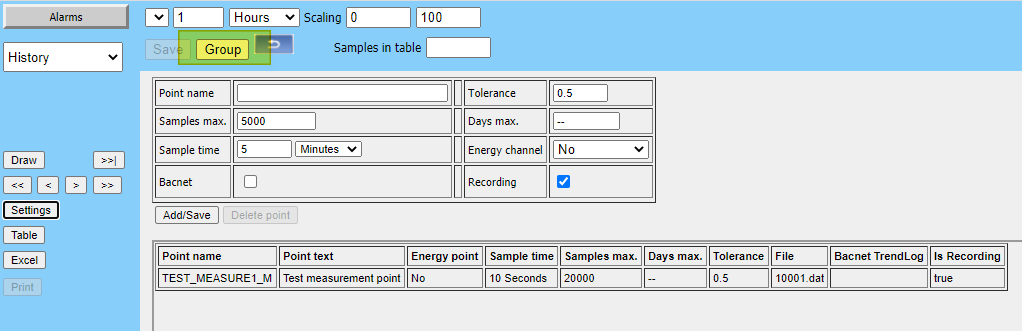
In the top field write a name for the history group.
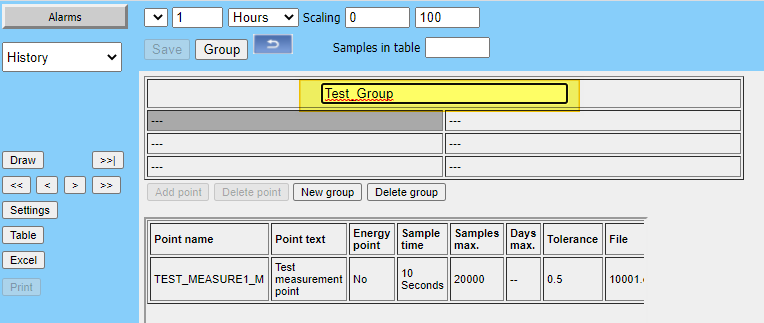
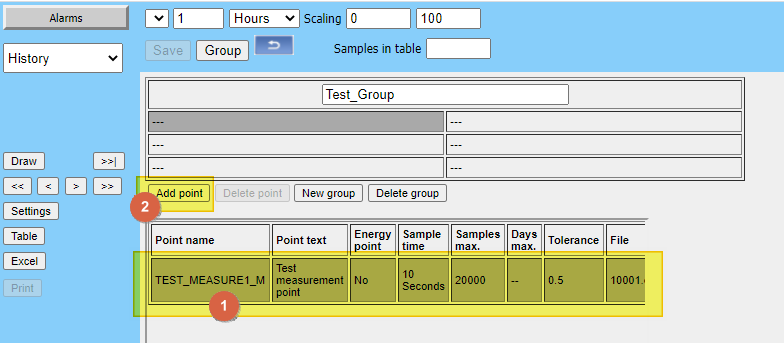
Then select a point to add to the history group. and press the "Add point" button.
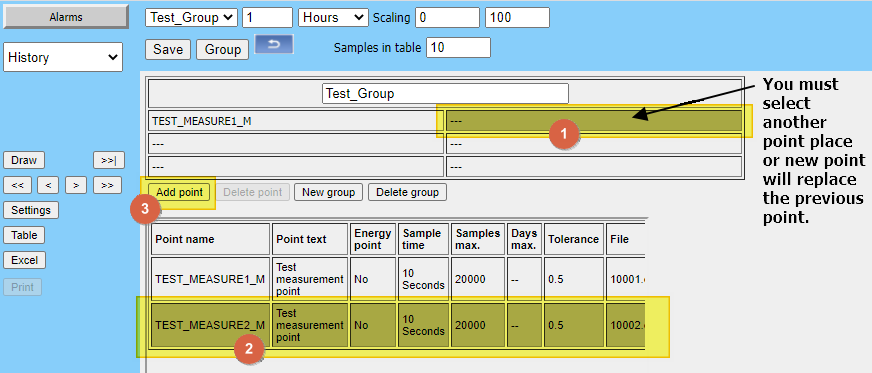
Other points can be added to the same history group by choosing another point place and repeating previous steps. At most 6 points can be set to one history group.
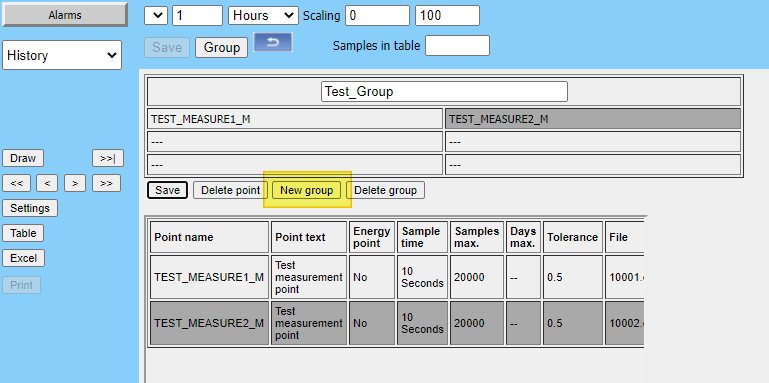
Next press on the "New group" button and this group will be created.
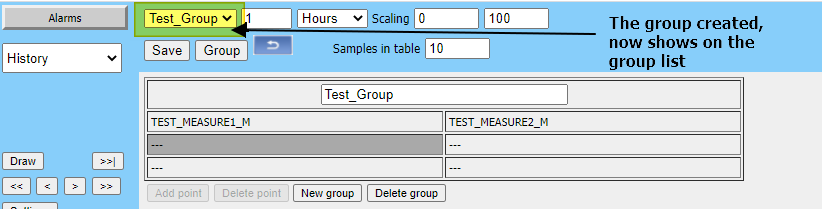
Now when you want to look at the history data, choose from the group list the group you want to view and click on the "Draw" button.
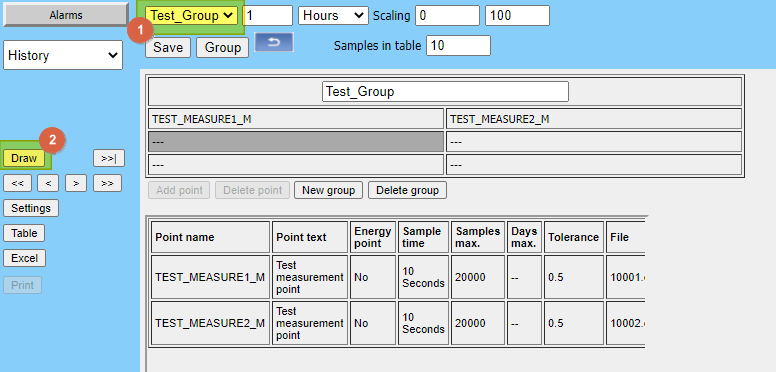
The history data will now show on screen.

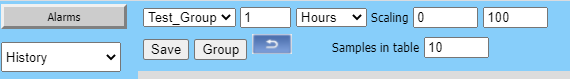
You can change the time of the data showing and set the scale of the graph with the settings at the top of the screen. The changes will show on the screen when you press again the "Draw" button.
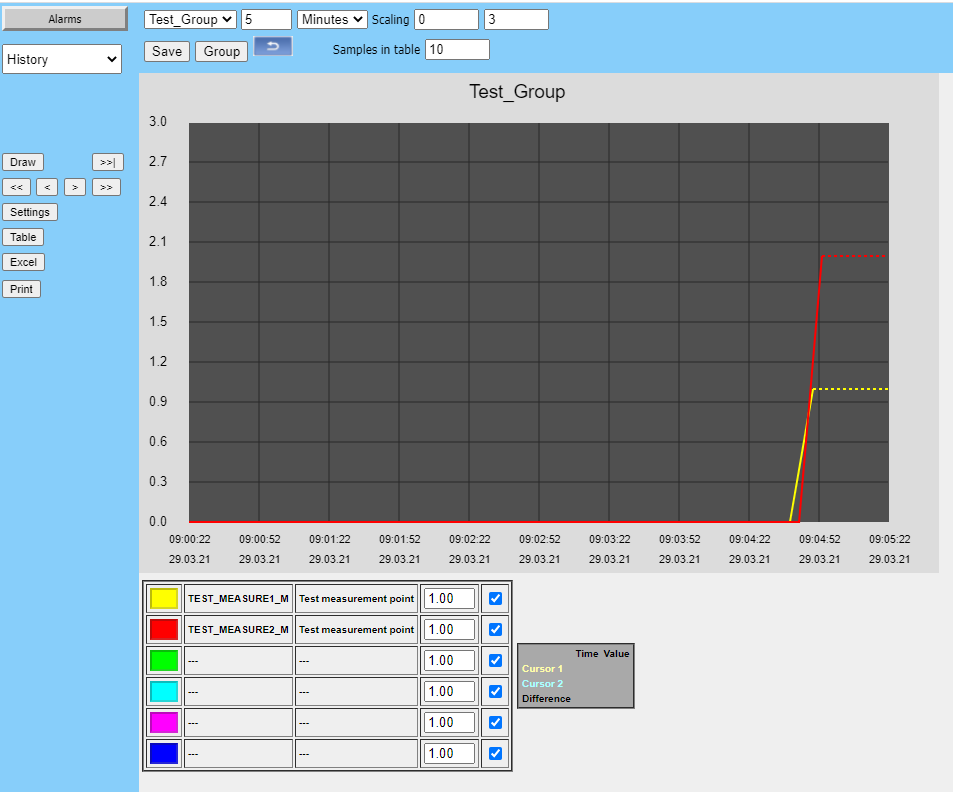
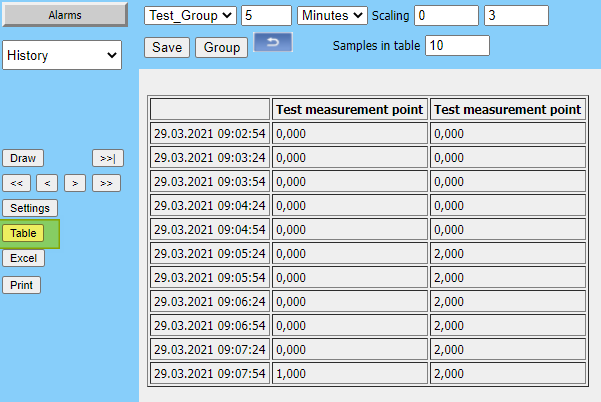
You can also view the data of the history group as a table, by pressing on the "Table" button.