To set history recording to points go to "Points" page in FX-Editor.
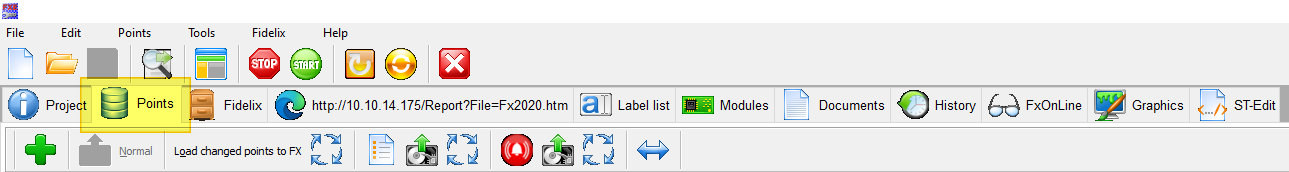
Then select the point you want to have history recording. and go to edit the point.
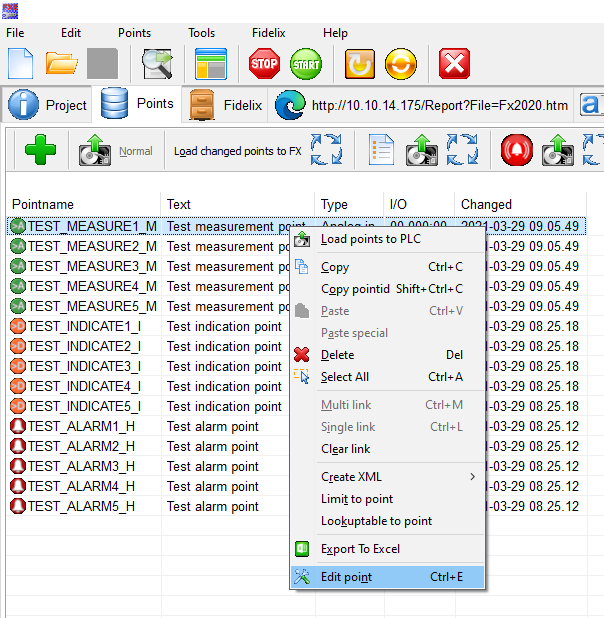
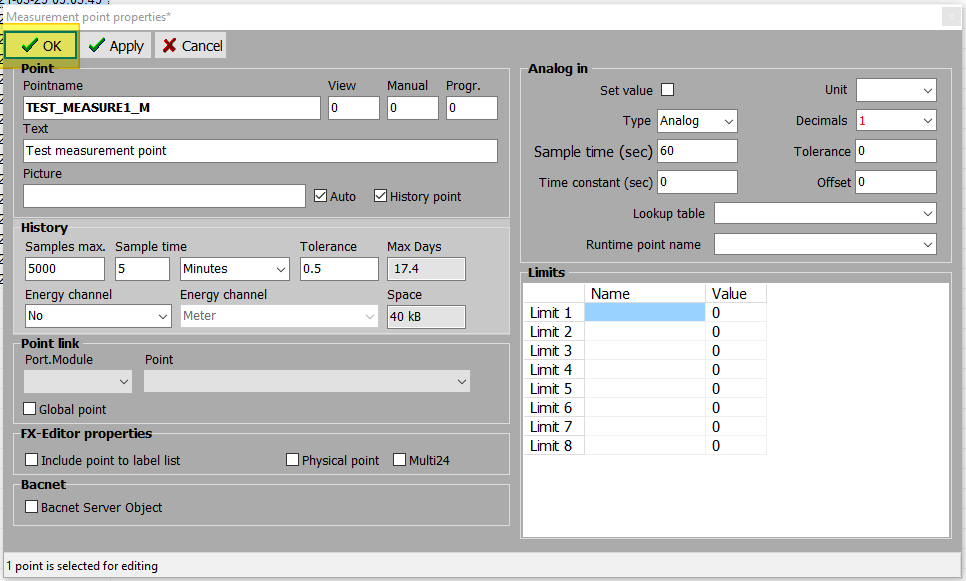
Then select "History point" from the points settings.
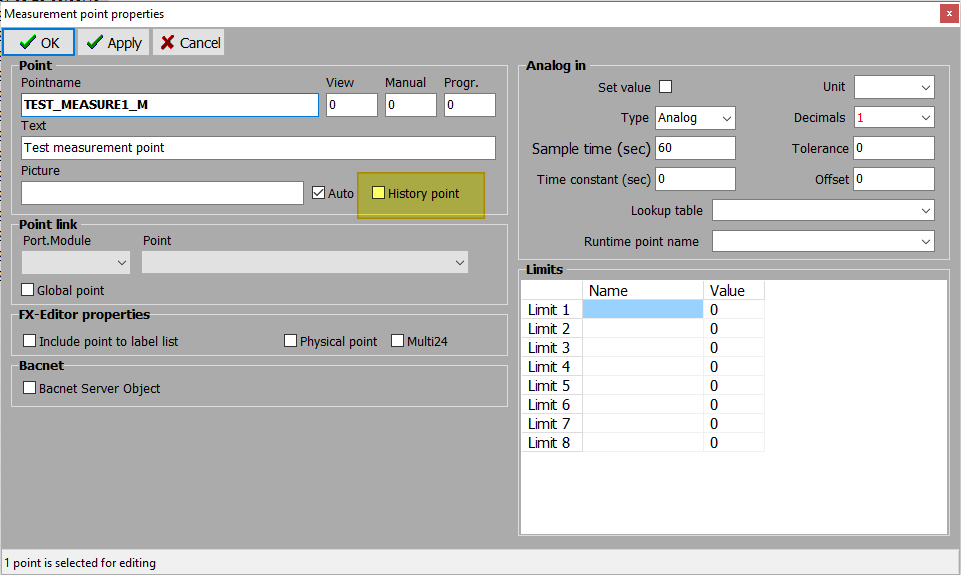
Now you will see the history settings for the point.
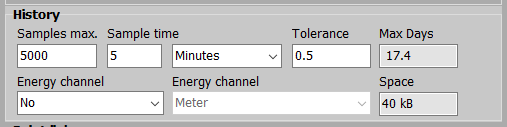
In the field "Samples max." you can choose how many samples from the point will be saved. Once the maximum amount of samples is reached the oldest values will be erased when saving new values. Maximum amount of samples for each point can be 20 000.
In the field "Sample time" you can choose the interval of saving the points value as a sample. Write in the field the number and choose from the dropdown menu whether the value is in seconds, minutes, hours or days.
The value in "Days max." field is calculated and is dependent on the Samples max. and Sample time values. This will tell you how long back the history of the point can be viewed with current settings.
With the value in "Tolerance" field, you can set a minimum value change for saving a sample. This can extend the length of the history as not all samples are saved, if the value has not changed enough.
Once you have set the desired settings for history saving. Click the "OK" button.
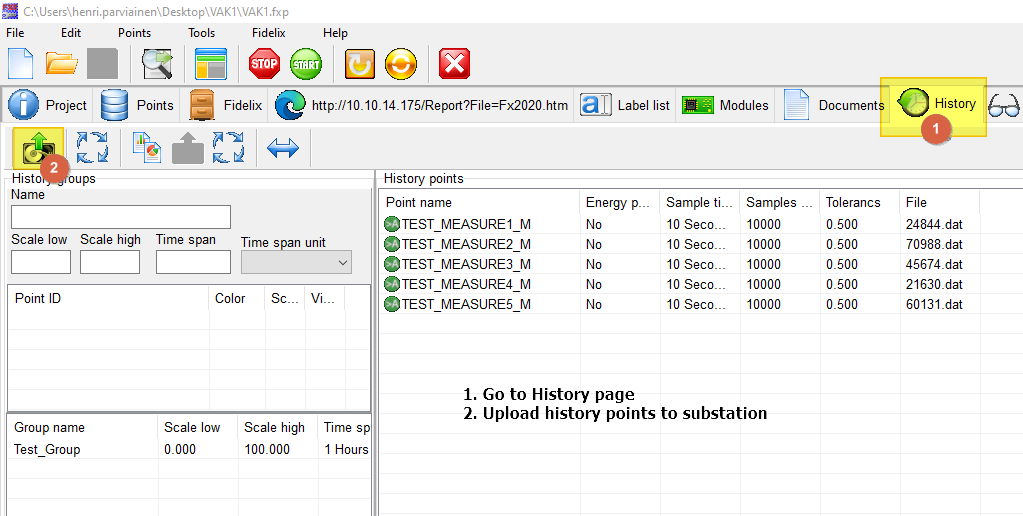
Next go to "History" page in FX-Editor.
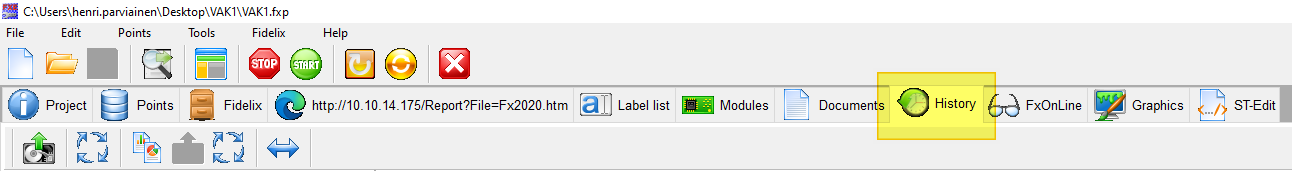
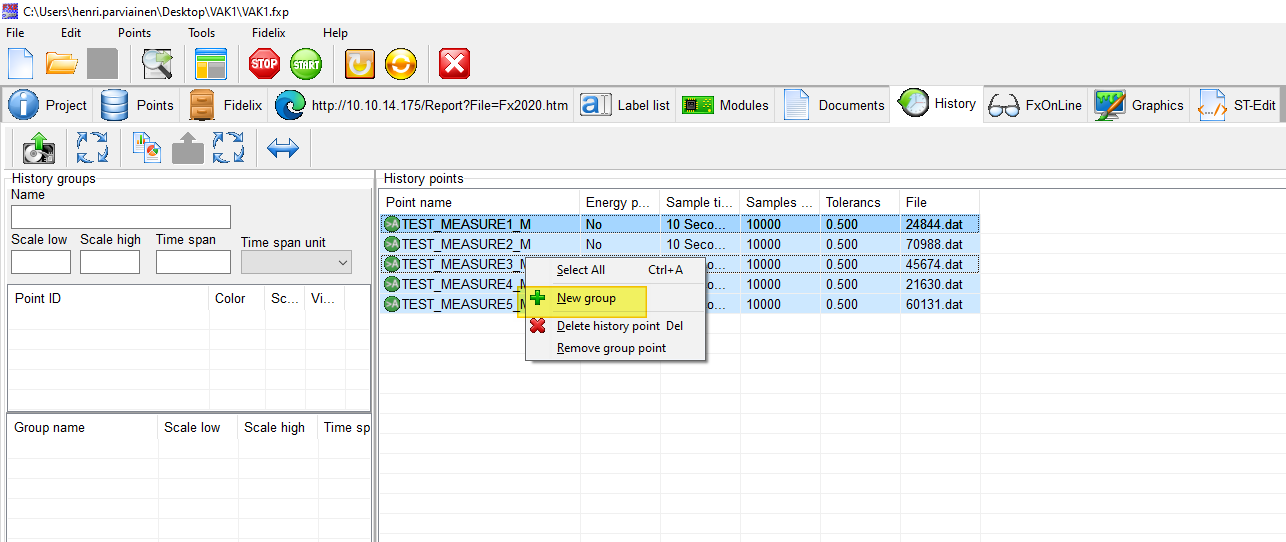
You will see in the list of "History points" the points that have the history settings active.
Right click on the point or choose multiple points and right click to create a new history group. At most 6 points can be set to one history group.
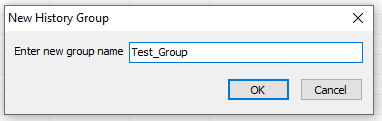
Write a name for the history group and click "OK".
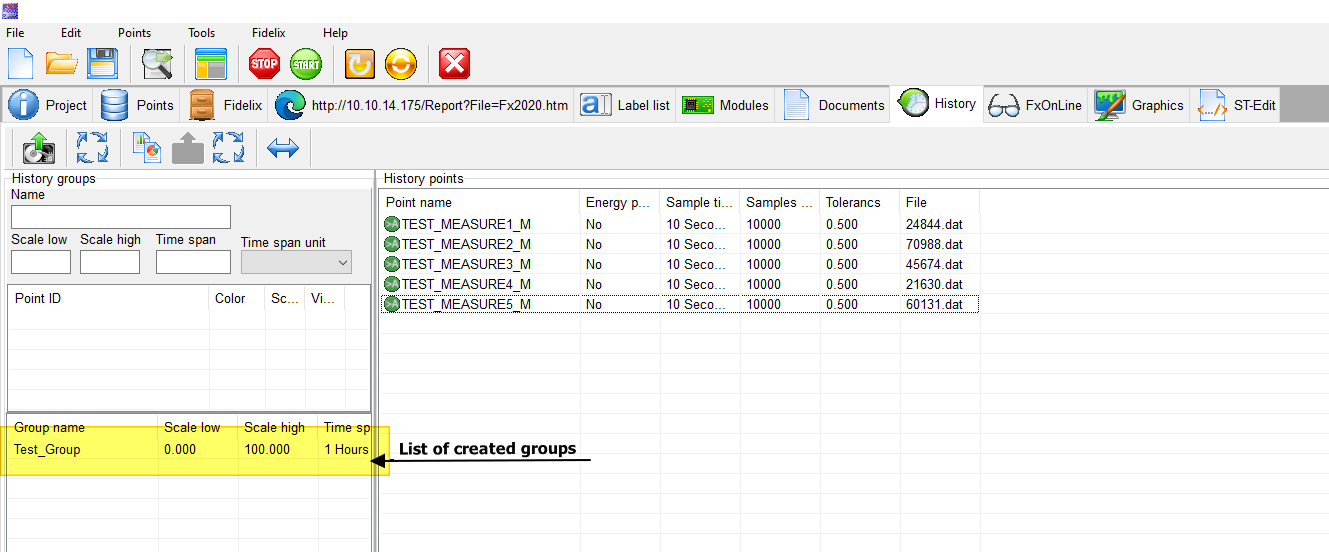
The group will now show in group list.
Now double click on the group in group list. This will open the group to edit.
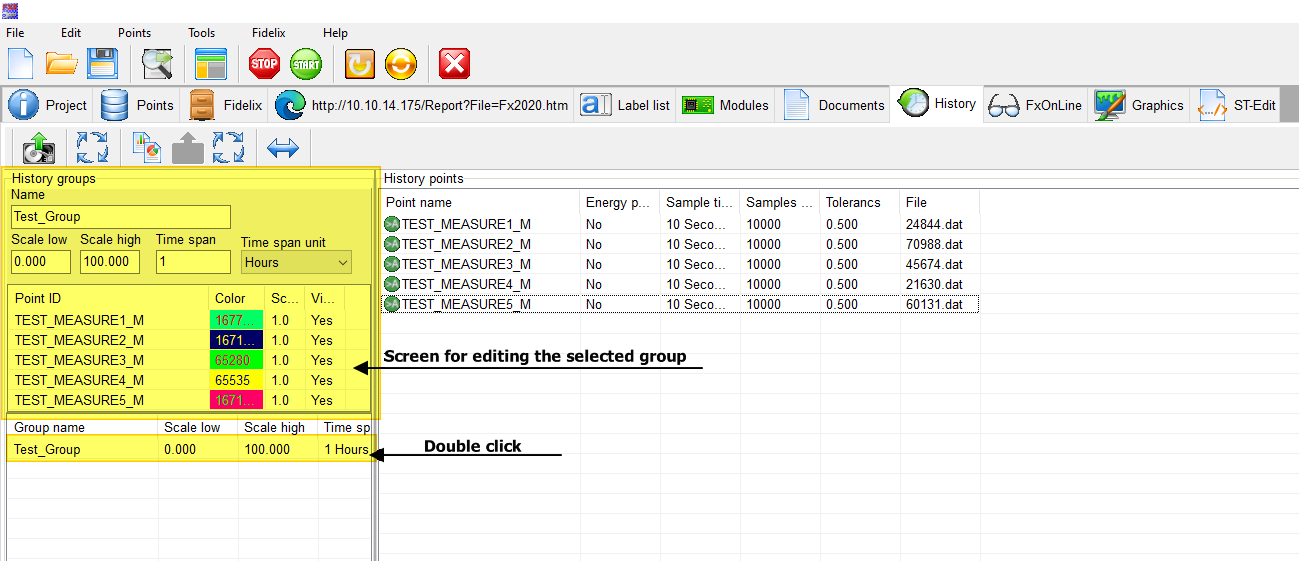
Here you can set the default display values for the group.
Settings "Scale low" and "Scale high" determines the default scale of the graph shown.
Settings for time span determines the default display time of the history data.
Now you can load these data in to the CPU.
First load the points from the Points page.
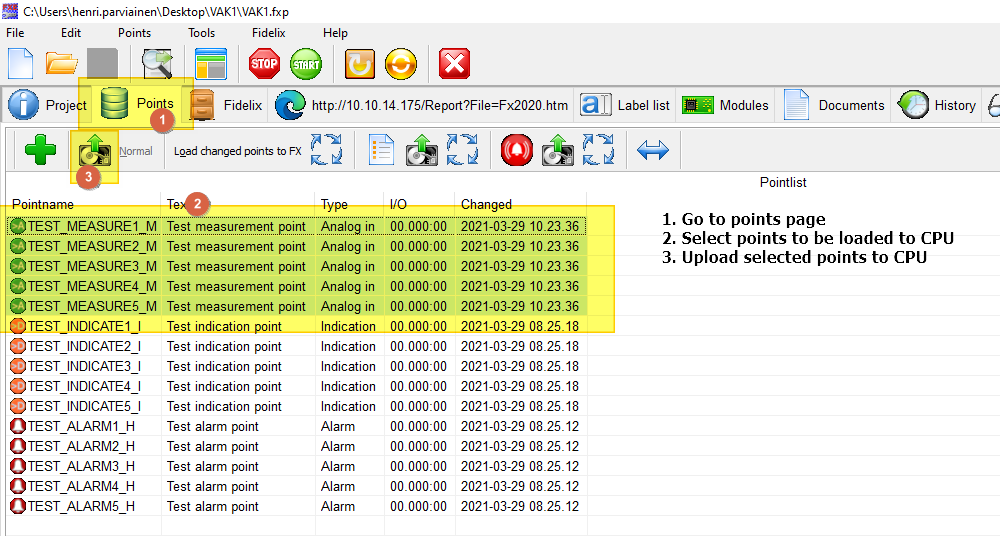
Next load the history group to the CPU.
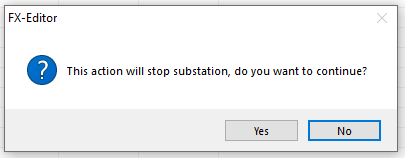
During this operation the CPU will be restarted. Click "Yes" to continue.
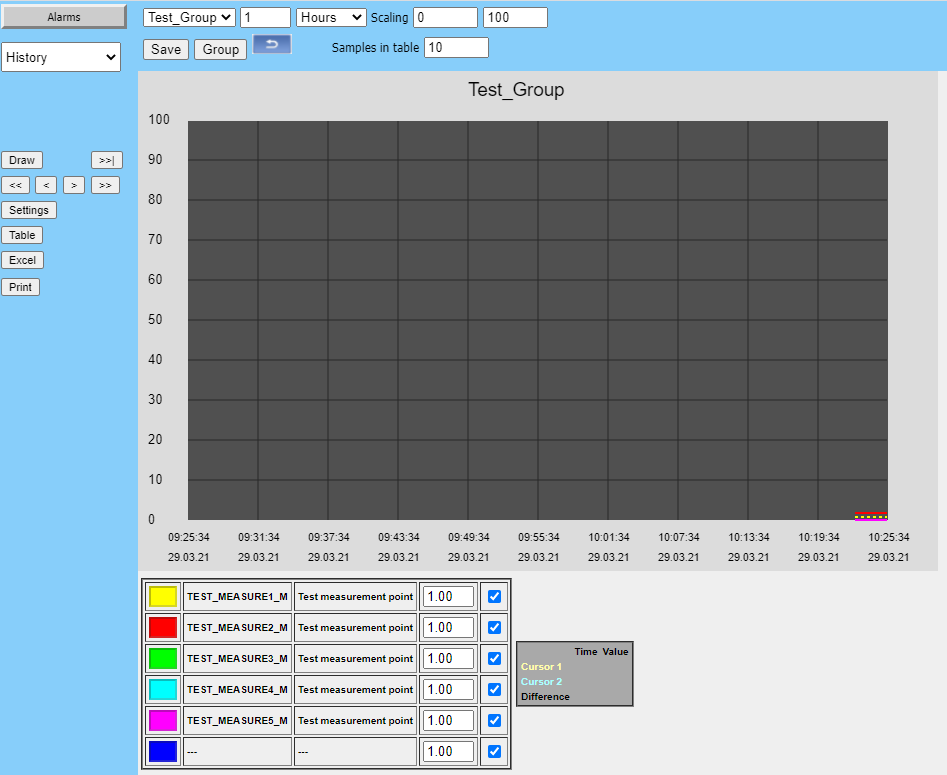
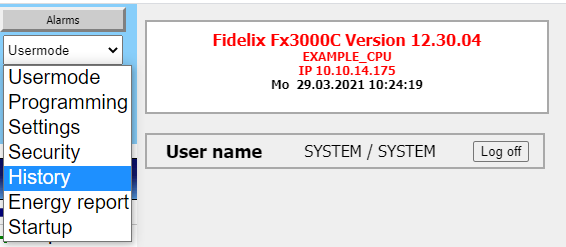
Now you can look at the data in the CPU.
From the dropdown menu at the top left of the substation user interface select the option "History"
Choose the history group you want to view from the list of groups and press "Draw".
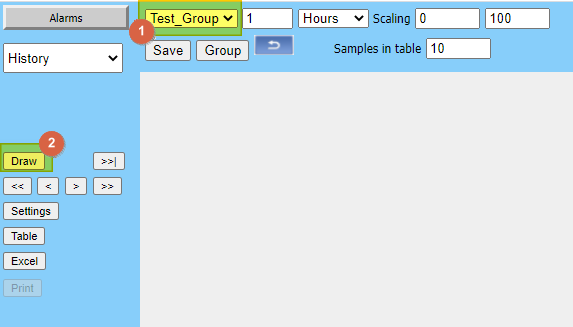
The history data will be displayed on the screen.